
Reporting and dashboards
The numbers that run the business, live
Dashboards and reports for production, stock, purchasing, sales and management, reflecting live data.
Standard dashboards and reports come with every plan from launch in March 2027. The report designer, customisable dashboards and built-in BI arrive with Complete in Q2 2027.
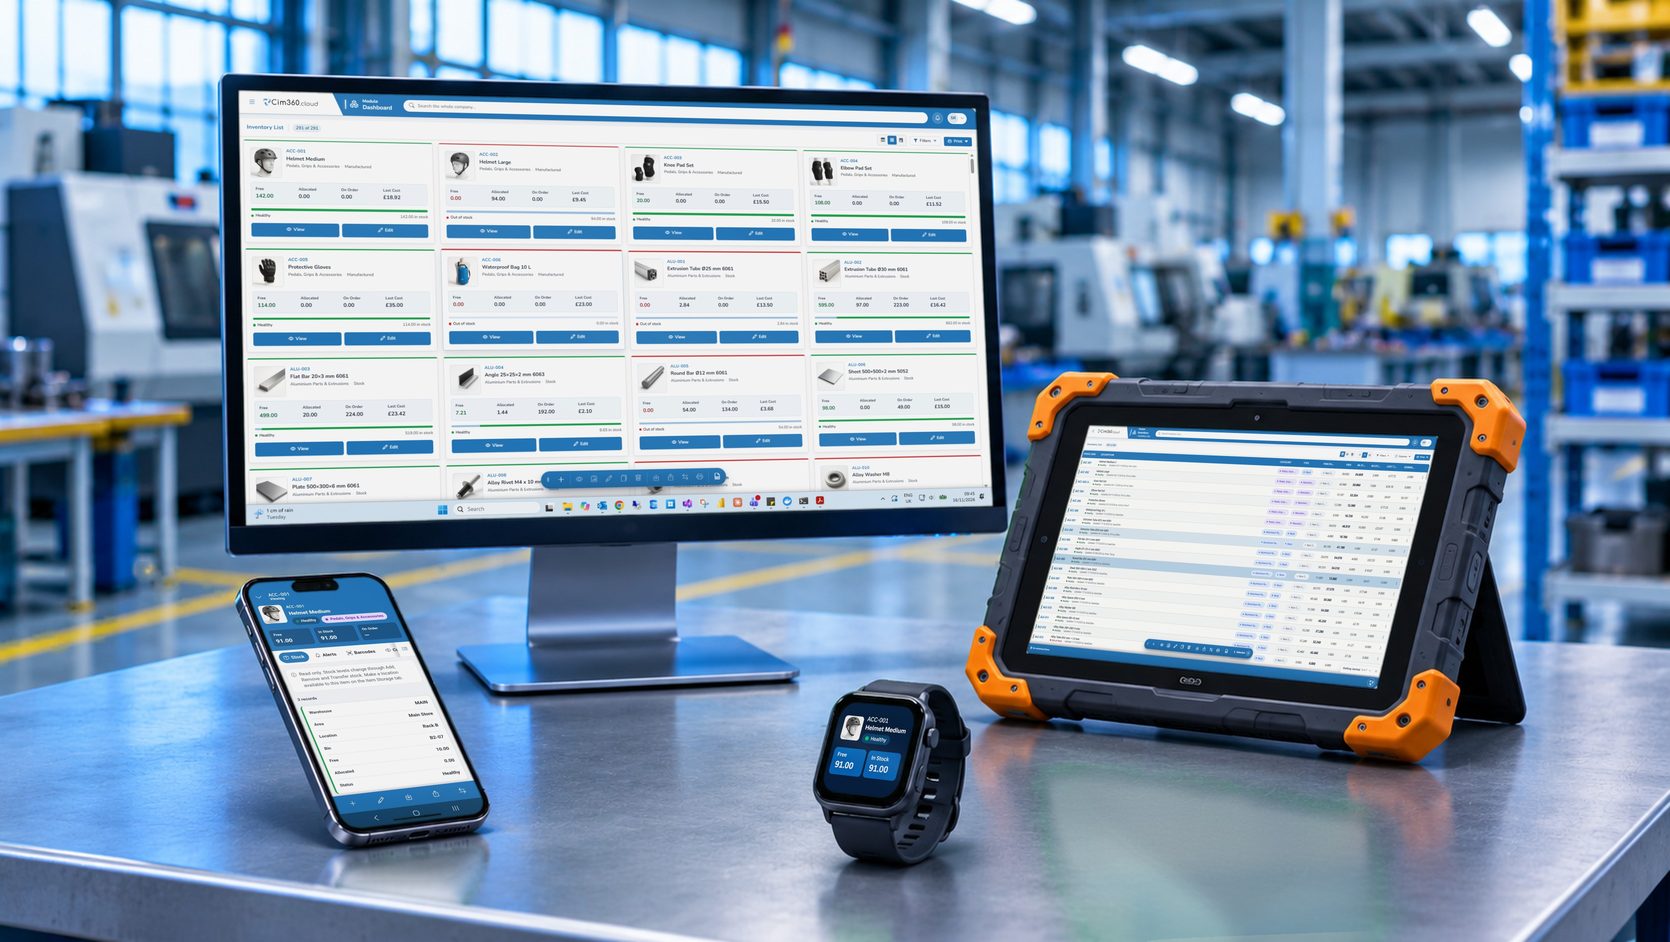
Dashboards
Role-based, live and clickable
Show each person the key figures for their role, updated from live data.
- KPIs, alerts and performance metrics such as overdue works orders, stock shortages and late deliveries
- Drill down from a figure to the records behind it
- Reports and views tailored to production, stock control, purchasing, sales and management
Reports
Reports people can act on
Find the answer, export it and share it, or have it emailed to you.
- Export any report or dashboard to Excel or PDF
- Ad-hoc report builder with your own fields, filters and groupings
- Key reports scheduled by email, daily or weekly
- Exception alerts for overdue jobs, low stock and late suppliers
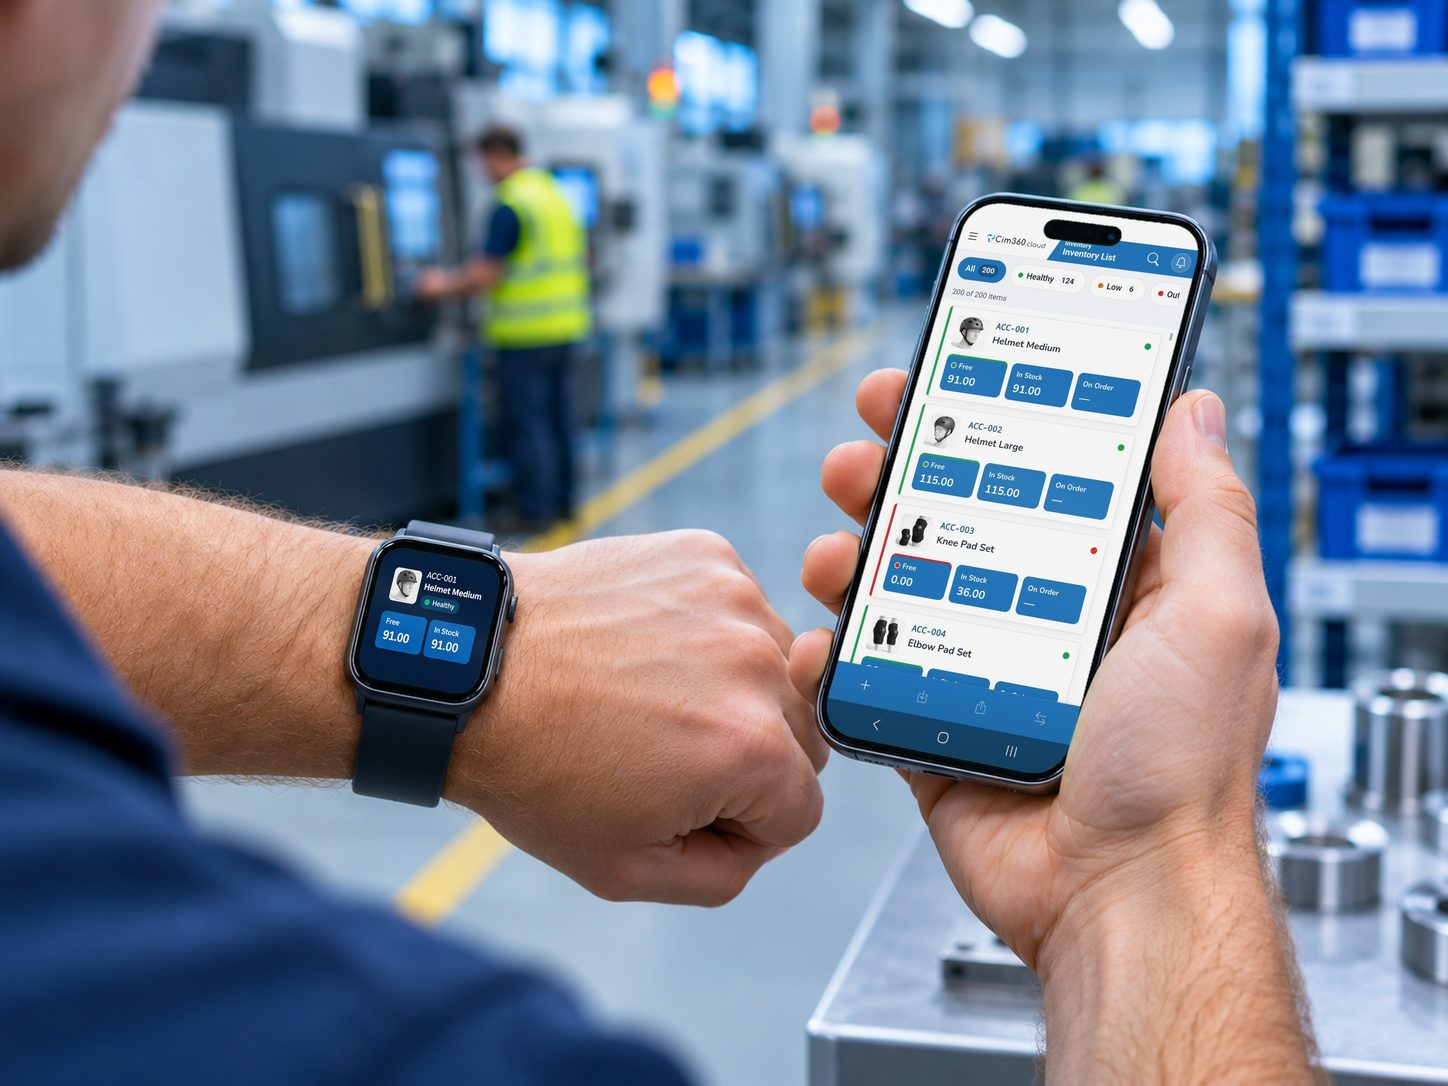
Business intelligence
BI built in, with your own tiles and SQL reports
On Complete (from Q2 2027), build your own dashboard tiles and SQL reports and design documents with the report designer.
- Customisable dashboards
- Report designer
- SQL reports of your own
Control
The right people see the right figures
Set which users or roles can open specific reports or dashboard elements, so sensitive figures stay with the people who should see them.
- User-level report permissions
- Departmental views that cut clutter
Which plan includes it: Standard dashboards and reports are on Core, enhanced dashboards and customisable documentation on Advanced, and customisable dashboards, the report designer and built-in BI and reporting on Complete. Core is available from March 2027; Advanced and Complete arrive in Q2 2027.
FAQs
Questions about reporting and dashboards
Can't see your question?
Can I export reports?
Yes. Export any report or dashboard to Excel or PDF.
Can I build my own reports?
Complete, from Q2 2027, includes BI and reporting built in, with your own dashboard tiles and SQL reports, and a report designer.
Can I click through from a dashboard figure?
Yes. Drill down from a dashboard KPI, such as late orders, to the underlying records, such as the affected works orders.

See it working with your own products
Start a free trial, or book a walkthrough with our team.
or anything first
- 30-day free trial
- Sample data to explore with
- A UK team behind you
Thank you
Our team will be in touch to arrange a time that suits you.